Tutorial
This short tutorial is aiming at walking the user through different input types and options of the Spring Model. For more technical explanation of the fields see the manual.
Topics
- Modeling using genomic coordinates
- Choosing the initial structure
- Choosing the resolution
- Model coordinates
- Stiffness
- Spherical container
- Loop types and Refinement
- Extracting interactions from hic files
- Modeling using data from ChIA-PET
Modeling using genomic coordinates
The easiest thing you can do is just paste the results of a chromatin experiment (in 7-column BEDPE format) into the Genomic Coordinates → Interactions section, set the resolution and run the model on default settings. That is the first thing we will do. Choose Example 2 in the top of the New Request box. Each line of the input is comprised of 7 fields: chromosome on which the first anchor is located, the beginning, than the end coordinate of the first anchor, than the chromosome, beginning and end of the second anchor and the PET count of the interaction. The PET count is ignored in the modeling process and so are chromosome numbers – remember, Spring Model is a tool for modeling chromosome domains, so input containing interchromosomal interactions will be treated as intrachromosomal. Just stick to modeling one chromosome at a time.
Resolution has been automatically set to 2000, which means that 2000 base pairs will be represented as one bead in the model.
Submit. Your task should be completed in a few seconds. Than you can grab the structure in the preview and rotate it in order to view it from different sides, as well as zoom in and out.
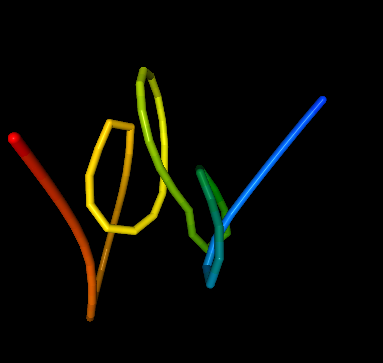
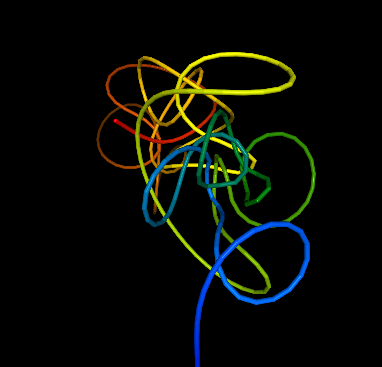 Example 2 with default settings
Choosing the initial structure
Note that your model probably looks slightly different from ours and that is because, although the interactions are the same, the initial structure was a random walk (self-avoiding random walk to be exact). That means it is created randomly for every model. It provides a structure already resembling how the chromatin is distributed in the nucleus, but it also means you will get a slightly different model every time, because one set of contacts can be satisfied by many different 3D structures. You can always download the initial structure and view it in UCSF Chimera (you can also download the final structure and the interactions that can be displayed in Chimera as pseudo bonds).
Random walk is a good choice for many purposes, but if high degree of reproducibility is important to you, it is better to choose a different initial structure. Click on Alter and resubmit. Choose a different initial structure and see how it affects the final model. Again, if you want to see the structure before the minimization of energy, Download initial structure and open it in Chimera. If you want to know more on how the different initial structures are created, see section Initial structure type in the manual.
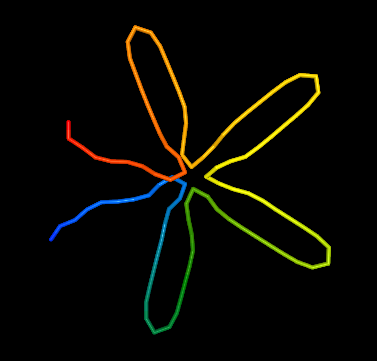
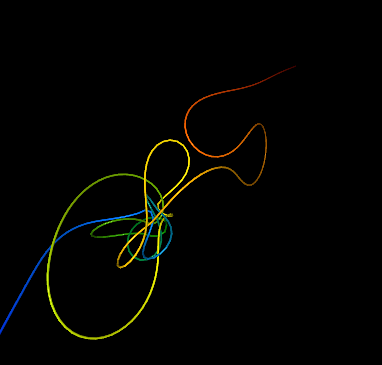 Example 2 with line as the initial structure
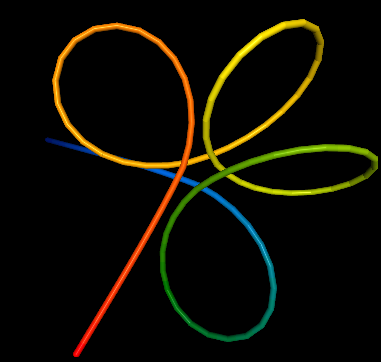
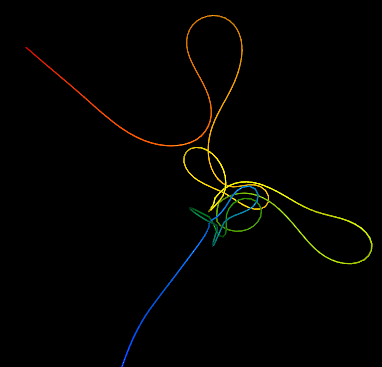 Example 2 with circle as the initial structure
Choosing the resolution
In the example resolution has been set to 2000. Try and experiment with lower and higher resolutions. Remember that very large resolution will give you a short structure, especially it should be much less than the length of the modeled region.
Now that we have covered the basics, we can investigate optional parameters that will give you more control over your model. Let’s go to Example 1 and submit it.
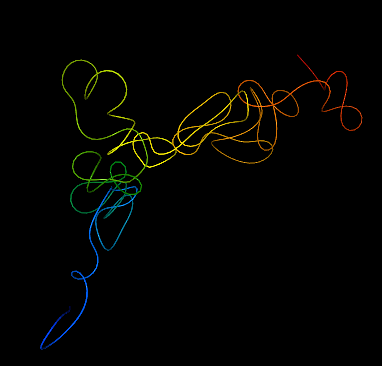 Example 2 with resolution set to 1000
 Example 2 with resolution set to 10000
Model coordinates
Example 1 uses model coordinates instead of genomic ones. This option is more explicit, the user chooses directly how many beads there will be and which ones are supposed to be connected.
By using any of the two options you can achieve exactly the same results, genomic coordinates are always translated into model coordinates before the building of a model. The middle points between the start and end coordinates of an anchor are taken as the coordinates of an interaction and than those points are scaled based on the region length and resolution. It is mostly the matter of convenience which method is more suitable.
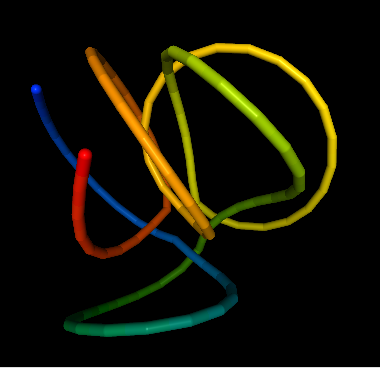
 Example 1 with default settings
Stiffness
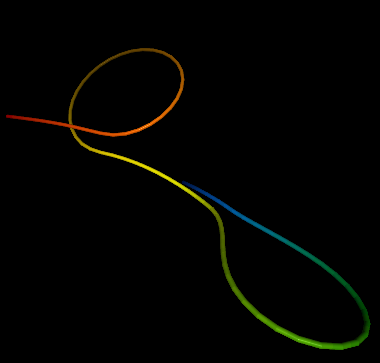
Now go back to the New request form, change stiffness to 0 and submit again. This is the structure without any stiffness-related force. The flower shape is still there, but it looks more collapsed, the Distance map has also changed - some distances are now smaller. If you move the structure around you will also see that the structure is more flat, it resembles more the initial structure which has been a circle.
Go back again and change to stiffness to 100. The structure seems very inflated, it is also very different from the initial structure, because there is a strong force making the fiber more rigid. It is often a good idea to experiment with the stiffness of your model to best cater for your needs and expectations.
 Example 1 with stiffness set to 0
 Example 1 with stiffness equal 100
Spherical container
This is an option if you want your model to fit in a certain volume. Let’s set the stiffness back to 10 and set the diameter of the container to 100.
Nothing has really changed because the container is bigger than the model, so it fits there easily without changing the shape. Come back and set the size to 10. The structure has now visibly smaller volume.
 Example 1 in a spherical container
Loop types and Refinement
The Spring Model enables enforcing loop types. You can choose an interaction to form a loop of a certain type by adding the loop type symbol in the line defining a contact. The allowed symbols are >>, << and capital H for a hairpin loop and <>, >< and capital S for a stem loop.
Choose Example 3 and see how it works. Than resubmit with the following contacts:
10 80 >>
20 30 <>
Here you can see clearly the different loop types.
Sometimes certain restraints may produce a model with anomalies. You can try two solutions: either run the model again with the same settings and see if this time it looks correct or you can check the box that says Refinement. In short, refinement helps escaping local energy minimum, but it may take longer time to calculate. See Manual if you want to know exactly how it is achieved.
 Example 3 with refinement
Extracting interactions from hic files
One of the most common type of chromatin interactions data are Hi-C matrices, and they are usually stored in binary hic files. Here we show example of possible way (but not the only one valid) how to transform hic matrix into model coordinates.
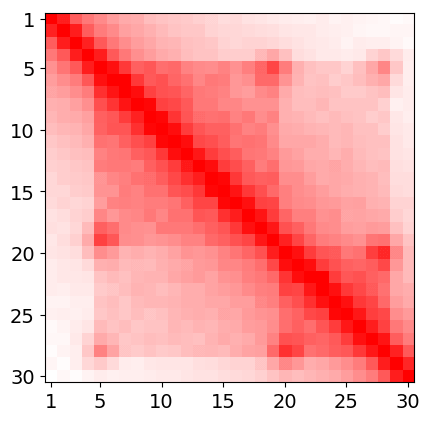
Let assume that we are interested with region of chromatin given by following heatmap and let assume that this heatmap represents region chrN:1'000'001-1'030'000 (i.e 300 kbp length) and it's resolution is 10kbp. (It is artificially generated heatmap, and example is intentionally simplified).
 artificially generated heatmap
In this example every bin in heatmap will correspond one-to-one to model beads. Thus heatmap resolution - 10kbp will also be a model resolution - every bead represents 10kbp. First bead corresponds to region chrN:1000001-1001000, second to chrN:1001001-1002000, third to chrN:1002001-1003000, and so on... Model will have 30 beads in this example. One of input method in spring model is using model coordinates - beads indexes or in other words indexes of heatmap bins after renumbering (first bin is at the beginning of region of interests, not the begin of chromosome). What we need to do is to find relevant interactions in heatmap and then translate their genomic coords into model coords.
Hi-C heatmaps are usually very dense in comparision to ChIA-PET. We can not simply take all non-zeros from heatmap because there will be to much interactions, and the model will collapse. Moreover Spring Model treats interactions as binary. They exist or not. We need to somehow make a loop-calling. The description of this procedure is out of the scope of this tutorial so we will perform the simplest possible approach, we will just choose the peaks from heatmap. In our case there are two loops that are additionally connected with higher order interaction. So in this very case it will be following model coordinates:
5  19
5  28
20 28
They can be directly pasted in model coordinates field. Remember also to fill number of beads field with 30.
Convenient way to extract interactions from relatively short regions from hic files is to use this python script.
usage: hic-converter.py [-h] [-i INFO] [-l LIMIT]
                        resolution loc infile outfile

Converts hic file into three column txt file

positional arguments:
  resolution            resolution in bp. SI k M G suffixes allowed (e.g. 2M 2k 1G)
  loc                   Chromosome name and (optionally) range, i.e. "1" or "1:10000:25000"
  infile                input file
  outfile               output file

optional arguments:
  -h, --help            show this help message and exit
  -i INFO, --info INFO  print hic file header and exit.
  -l LIMIT, --limit LIMIT
                        Skip bins with Count lower than this limit [default: 1]
Example of valid command usage:
python3 hic-converter.py -l 30 10k 1:236000001:241000000 my_hic.hic model_coordinates.txt
Notes:
- Script require python 3.3.0 or newer and Straw package.
- Resolution must match to one of defined in hic file. If you don't know what resolutions are available in your file use -i option to read the header of file.
- Use -l option to adjust cutoff level. Experiment with different values. The proper value depends on region length, and deep of sequencing. According to our experiences you should stay between 2-20 beads per interaction to achieve best results. If you choose to little or too short interactions model will not fold. If you choose to much, the model will collapse.
Modeling using data from ChIA-PET
Interactions from experiment ChIA-PET are usually stored in BEDPE files. Spring model allows direct pasting interactions saved in BEDPE file, however there are some extra requirements. They should have 7 columns. Columns 1-3 and 4-5 describes two anchors of loop, chromosome id, begin, end. Chromosomes ids should be identical in both anchors. The last column is for PET-Count. Spring Model does not use PET-Count. SM treat interactions binary. Under the hood SM calculates midpoints of anchors and then translating genomic positions into model coordinates according to formula: (x - begin of modelling region) / resolution
Example of valid input:
chr7	141319306	141319888	chr7	141502227	141502862	7
chr7	141439952	141440562	chr7	141475636	141476247	4
chr7	141440408	141441058	chr7	141540288	141540817	4
chr7	141521373	141522026	chr7	141649615	141650144	4
chr7	141532718	141534198	chr7	141648797	141650013	6
chr7	141532773	141533502	chr7	141650079	141651001	4
chr7	141533511	141534645	chr7	141650062	141651061	4
chr7	141535611	141537022	chr7	141649504	141650652	5
chr7	141655299	141655869	chr7	141693222	141693832	5
chr7	141653441	141654793	chr7	141709665	141711118	9
chr7	141656215	141657786	chr7	141710387	141711077	4
chr7	141653134	141655804	chr7	141736601	141739391	40
chr7	141655948	141657565	chr7	141737637	141738765	4
chr7	141652717	141656457	chr7	141783888	141787090	43
chr7	141656940	141657491	chr7	141792255	141792903	8
chr7	141701006	141702162	chr7	141737490	141738745	9
chr7	141737478	141738238	chr7	141785355	141786856	5
chr7	141754144	141756309	chr7	141785377	141787018	8
Remember that if you have too much interactions the model will collapse, and if you have too little or too short, the model will not fold. We recommend to stay between 2 and 200 beads per interaction limit. Usually it worth to experiment with different density of interactions. Optimal parameter is strongly dependent on modelling goal and particular data.
You can easily filter your data using awk oneliner below.
awk '{if ($7 > 9) print $0}' my_interactions.bedpe > my_filtered_interactions.bedpe
where ($7 > 9) mean that we expect column 7-th to be greater than 9. Analogous method can be used for other types of experiments saved in BEDPE file.